
Restaurant Guest Satisfaction Snapshot™ – August, 2021
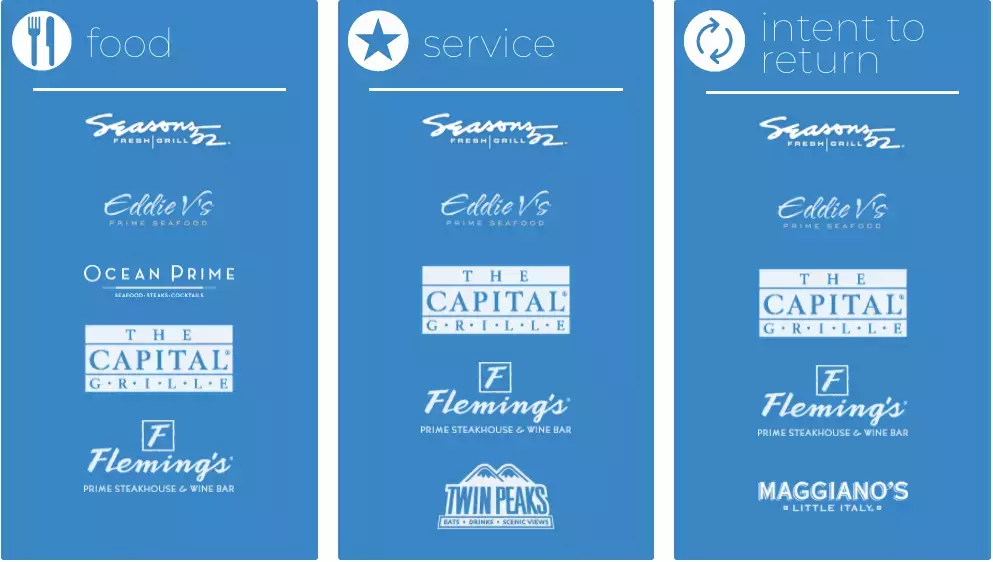
Top 5 Restaurant Brands
August saw a reversal in the upward momentum the restaurant industry’s sales and traffic had been riding in recent months. Amid a rising number of COVID cases and wide media coverage of its Delta variant, sales growth was 6.1% during the month, a drop of 2.1 percentage points compared to July’s strong sales growth. This was the softest sales growth reported for any month since May, and the worst traffic growth in the last three months. Traffic growth was -5.4% during August.
Guests were marginally more positive about restaurant “food” during August compared to a year ago based on their online reviews and comments. In August 2020, the percentage of sales flowing through off-premise channels was much higher, which tends to result in lower “food” sentiment scores. So, the small improvement in the percentage of positive mentions in August 2021 despite the easy comparison a year ago highlights the difficulties restaurants are facing regarding food execution due to staffing shortages and supply chain issues.
Similarly, the percentage of online reviews and comments focused on restaurant “service” remained essentially flat year over year in August. The biggest drop in positive sentiment year over year was related to restaurant “ambiance”. The last three months have experienced the lowest percentage of “ambiance” positive mentions since the beginning of the year.
Connecting the Dots on Performance
The COVID Sales Shift: How It Impacted Restaurant Guest Sentiment
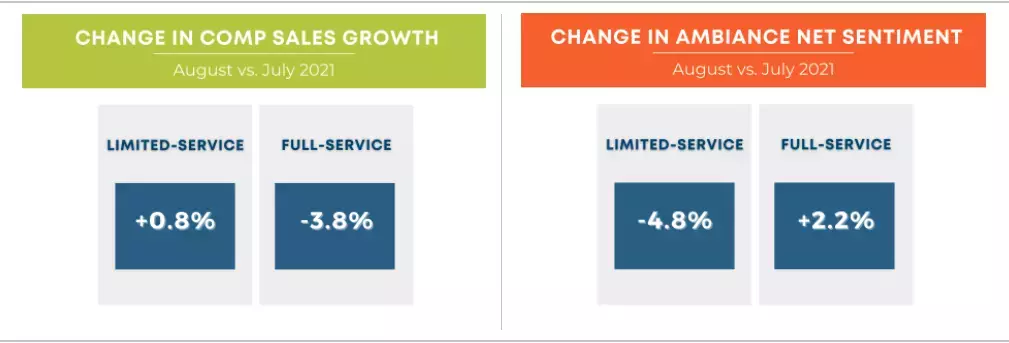
The downturn in sales experienced by the industry during August did not affect all segments equally. For limited-service brands, it was not a downturn at all. Consequently, the effects on guest sentiment of these shifts in business activity also differed between limited-service restaurants and those in full-service.
In the case of full-service restaurants, their sales growth rate dropped by 3.8 percentage points compared to July. Less sales and traffic meant less pressure on execution, especially while operating under an environment plagued by staffing shortages. This translated into overall net sentiment for full-service restaurants increasing slightly month over month, driven by a strong improvement in the family dining segment. Sentiment increased across all key topics tracked, but the month-over-month guest sentiment of “food”, “service” and “ambiance” for family dining was particularly strong.
Casual dining, upscale casual, and fine dining guest sentiment held steady for “food” and “service”, but “ambiance” improved. Combined, all segments in full-service improved by 2.2 percentage points in their “ambiance” net sentiment scores. Throughout the pandemic, “ambiance” has been a key driver of guest sentiment, given its connection to cleanliness.
The story was quite different for limited-service brands. When COVID fears escalate, guests tend to shift some of their restaurant spending towards limited-service brands and less towards those in full-service. Limited-service brands experienced a 0.8 percentage point improvement in their sales growth in August compared to July.
Additional sales and traffic created extra pressures to execute for those in quick service and fast casual. Limited-service restaurants experienced a decrease in guest net sentiment during the month, with the steepest declines coming from fast casual. Not surprisingly, Fast Casual’s improvement in sales growth during the month was almost triple the improvement posted by Quick Service. Fast casual had a much tougher challenge keeping up with the added demand. “Service” and “ambiance” had the biggest drops in net sentiment for this segment. Sentiment for quick service was down for nearly all topics as well.
Top DMAs
- Food- Orlando, FL
- Service- Philadelphia, PA
- Intent to Return- Orlando, FL
- Beverage- Orlando, FL
- Ambiance- Orlando, FL
- Value- Orlando, FL
Bottom DMAs
- Food- San Francisco, CA
- Service- San Francisco, CA
- Intent to Return- San Francisco, CA
- Beverage- St. Louis, MO
- Ambiance- St. Louis, MO
- Value- Charlotte, NC
Out of the 25 largest markets in the country, Orlando led on positive sentiment based on restaurant “food”, “beverage”, “ambiance”, “value” and “intent to return”.
On the other end of the spectrum, August was a bad month for restaurants in San Francisco. Based on restaurant sales growth it was the 2nd lowest-ranked among the top 25 biggest markets in the country (the New York DMA had the lowest sales growth in August). Additionally, it also led to the lowest net sentiment based on restaurant “food”, “service” and “intent to return” during the month.