Restaurant Guest Satisfaction Snapshot™ – January 2022
Analyzing January 2022: Restaurant Sales Dip, Traffic Woes Continue, and Guest Sentiment Reflects Operational Challenges
A restaurant sales downturn that began in December continued into January. The industry posted negative sales growth for the first month since February 2021. Sales growth was –0.9% in January, a drop of 2.9 percentage points compared to the December growth rate. Despite the disappointing results, the industry is better positioned from a sales perspective compared to over a year ago. Sales growth for the period between November 2020 and January 2021 averaged –15.9 % as the industry contended with a new wave of Covid cases during that winter. Omicron may have caused a slowdown, but restaurants are on much more solid ground now when it comes to sales.
The industry continues to struggle with guest counts. Traffic growth was -15.6% in January, down 6.2 percentage points compared to December, and over twice the drop seen in sales growth. January’s traffic growth is not that different compared to the average -18.8% seen in November 2020 through January 2021. Rapidly increasing average checks are likely keeping guests from visiting restaurants more frequently, contributing to the erosion of traffic growth even though sales growth is much stronger. Check growth jumped in January, a new record high.
Guest sentiment around food improved during January; however, the longer-term view provided by the rolling 3-month average indicates the percentage of positive reviews remains relatively unchanged year over year. Service sentiment has dropped by an average of 1.8 percentage points over the last three months compared to the same period a year ago. Intent to return positive sentiment, which dropped by over 5 percentage points during the same period, indicated an even larger decline. There is no doubt staffing and supply chain shortages have negatively impacted restaurant execution, and guests are noticing it.
Connecting the Dots on Performance
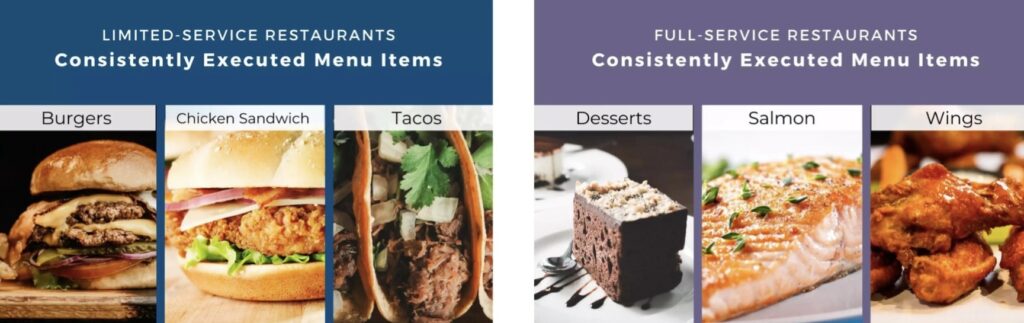
During the last three months (November 2021 through January 2022), limited-service brands seem to have consistently executed burgers, chicken sandwiches, and tacos. In the case of burgers, there were 4.1 positive mentions in reviews for every negative mention of this menu item. Chicken sandwiches also received more positive mentions in reviews, but the ratio is smaller at 3.4 positive mentions for every negative mention. In the case of tacos, guests of limited-service brands were only about twice as likely to approve than disapprove of their order.
Food items that limited-service brands had a tougher time consistently executing were rice, guacamole, and steak. All these menu items received a larger number of negative mentions than positive ones when tied to limited-service brands.
Not surprisingly, things are different for full-service restaurants. Full-service brands consistently execute desserts, salmon, and chicken wings. For desserts, full-service restaurants received almost 7 positive mentions for every negative mention. From there, the ratio of positives drops considerably. Both salmon and chicken wings received slightly more than 3 positive mentions in reviews for every negative mention.
The food items that are trickier to execute by full-service brands are fries, eggs, bacon, and pasta. All of these have less than 1.5 positive mentions for every negative mention.
Top DMAs
- Food- Orlando, FL
- Service- Houston, TX
- Intent to Return- Houston, TX
- Beverage- Detroit, MI
- Ambiance- Houston, TX
- Value- Orlando, FL
Bottom DMAs
- Food- San Francisco, CA
- Service- San Francisco, CA
- Intent to Return- Seattle, WA
- Beverage- Charlotte, NC
- Ambiance- Seattle, WA
- Value- Charlotte, NC
Regional & Market Performance: Guest Sentiment Strong on East Coast
Guest Sentiment Insights
Out of the 25 largest metropolitan areas in the country, two dominated in terms of having the most positive restaurant net sentiment during January. Orlando was where guests expressed having the most positive net sentiment based on restaurant food and value during the month. It was Houston where restaurants obtained the strongest net sentiment based on their execution of service and ambiance, as well as the strongest intent to return. Detroit rounded up the list of the most positive markets, with the highest beverage sentiment during January.
On the opposite end of net sentiment, three markets struggled the most based on guest sentiment during the month. San Francisco had the lowest net sentiment based on restaurant food and service, Charlotte had the lowest scores for beverage and value, while Seattle was at the bottom of the list with the lowest ambiance and intent to return the guest sentiment.