Restaurant Guest Satisfaction Snapshot™ – February, 2022
Sales growth was 2.7% in February, an improvement of 3.5 percentage points from January’s disappointing -0.8% growth and the 2.1% sales growth reported in December. Despite this rebound, the industry is far from returning to sales growth rates above 8.0% from October and December of 2021. Restaurant sales have slowed down significantly from the robust growth experienced during the majority of last year.
Behind this decline in sales growth is a similar slowdown in guest counts. Traffic growth was -13.8% in February. Although this represented a 1.6 percentage point improvement over January, restaurants have posted double-digit traffic losses for the last two months. Sales growth improved over twice the rate of traffic in February, as average guest check growth accelerated again. Skyrocketing check growth remains a concern for traffic recovery, especially in light of rapidly rising prices throughout the economy, which continue to erode consumer purchasing power.
The improvement in sales and traffic is also being reflected in the rise of positive guest sentiment in recent months. Of those positive online reviews centered around restaurant food increased by 2.5 percentage points year over year in February, while the improvement in positive service-focused reviews was 2.7 percentage points during the same period. However, sentiment based on guest intent to return has not improved recently, which does not bode well for an acceleration in guest counts in the upcoming months.
Check Growth Important Factor For Traffic Growth and Stronger Value and Intent to Return Sentiment
A hot topic in the restaurant industry is rapidly increasing menu prices and average guest checks. While the industry has been able to achieve positive sales growth through rapid check growth, the increasing menu prices may be keeping guests away from restaurants, or at the very least diminishing their frequency in restaurant spending. How much of a factor, if any, has check growth had on guest sentiment and restaurant traffic?
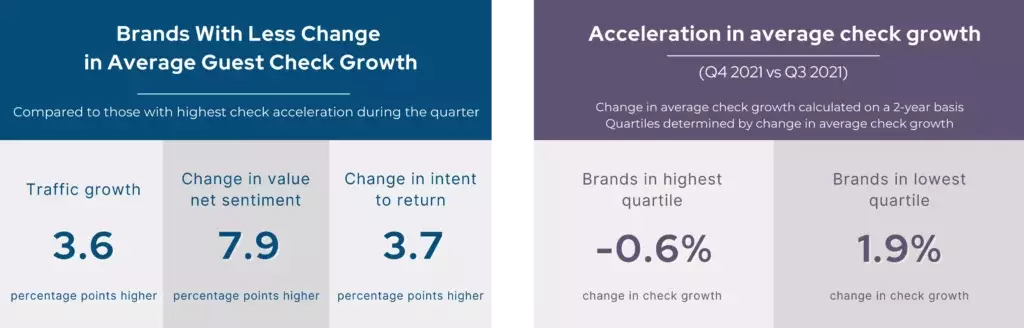
A recent Black Box Intelligence study revealed that restaurant brands with the smallest acceleration in their 2-year average check growth in Q4 2021 compared to Q3 obtained higher traffic and net sentiment results than those that accelerated check growth the most during the same period. The data suggests that guests were more satisfied with the value they received at the restaurants that had slower check growth, which translated into better-stated intent to return and the slowdown of guest count erosion.
The first group decelerated its check growth rate by 0.6 percentage points quarter-over-quarter, while the second accelerated its check growth by a significant 1.9 percentage points. Although traffic growth dropped for both groups, those with the deceleration in check growth were able to achieve 3.6 percentage points higher traffic growth than those that accelerated their check growth the most.
Furthermore, those who decelerated their check growth experienced improvements in value net sentiment during the quarter, while it fell for those who accelerated their check growth the most. The difference between the quarter-over-quarter value sentiment of the two sets of companies was 7.9 points. Guest checks may be rising rapidly for most companies, but those that were able to reduce that rate of increase have seen a stronger response in value sentiment from their guests.
Connecting the Dots on Performance
The effect on sentiment extended beyond value. Restaurant companies that decelerated their check growth during Q4 achieved a small rise in their guest intent to return, while it dropped for those accelerating check growth. The difference in the quarter-over-quarter change in intent to return sentiment was 3.7 points.
Top DMAs
- Food- Orlando, FL
- Service- Orlando, FL
- Intent to Return- Houston, TX
- Beverage- Houston, TX
- Ambiance- Orlando, FL
- Value- Orlando, FL
Bottom DMAs
- Food- San Francisco, CA
- Service- San Francisco, CA
- Intent to Return-San Francisco, CA
- Beverage-Raleigh, NC
- Ambiance-Cleveland, OH
- Value- Seattle, WA
Regional & Market Performance
Orlando is a major metropolitan area with consistently positive restaurant guest sentiment. During February, this market topped the list as having the most positive sentiment based on restaurant food, service, ambiance, and value. The market with the most positive sentiment for restaurant beverages and intent to return was Houston.
On the other end of the spectrum, San Francisco has been struggling with guest sentiment in recent months. During February, this metropolitan area had the least positive sentiment based on restaurant food, service, and intent to return.