Restaurant Guest Satisfaction Snapshot™ – July 2021 Top 5 Restaurant Brands
July Restaurant Sales Surge, but Guest Counts Lag: A Look at Guest Sentiment Amid Delta Concerns
Same-store sales growth was 8.1% in July, an improvement of 1.3 percentage points compared to June’s results. This was the fifth consecutive month of positive sales growth for restaurants and the strongest sales growth for the industry in over 3 years.
The industry is struggling to see growth in its guest counts. Same-store traffic growth was -3.7% during June. Encouragingly, this is the smallest loss in guest counts recorded during any month since the beginning of the pandemic.
However, these results were achieved as COVID cases surged again throughout the country and the delta variant dominated the headlines. While its effect on restaurant sales and traffic seems to have been minimal during July, there is concern for a slowdown in sales and traffic in upcoming weeks if new infections continue rising rapidly. The downturn will be largely regional and focused on the new COVID hotspot states.
The relative strength of the industry is present in the percentage of positive “food” mentions. Over 50% of comments on review sites and social media posts centered around restaurant “food” were classified as positive. The percentage of positive “food” mentions improved by 6.5 percentage points compared to July of 2019. Still, positive sentiment declined from the peak for the year, which was back in May.
The story is similar for service. Over 50% of reviews and social media posts that were based on restaurant “service” were classified as positive during July, an improvement of 4.8 percentage points in positive sentiment over 2 years. But as sales and traffic improved during the second quarter of 2021, positive “service” sentiment slipped.
Guest Sentiment Shifts: The Impact of Growing Restaurant Sales and Staffing Challenges
The second quarter of 2021 brought a swell in restaurant sales and traffic. Same-store sales growth improved by 10 percentage points over Q1, while traffic improved by 9 percentage points. But as more guests returned to restaurants, that put a lot of pressure on operators, especially considering the severe staffing crisis facing the industry in recent months. Given this convergence of factors, it was not surprising to find that guest sentiment slipped across all categories during Q2.
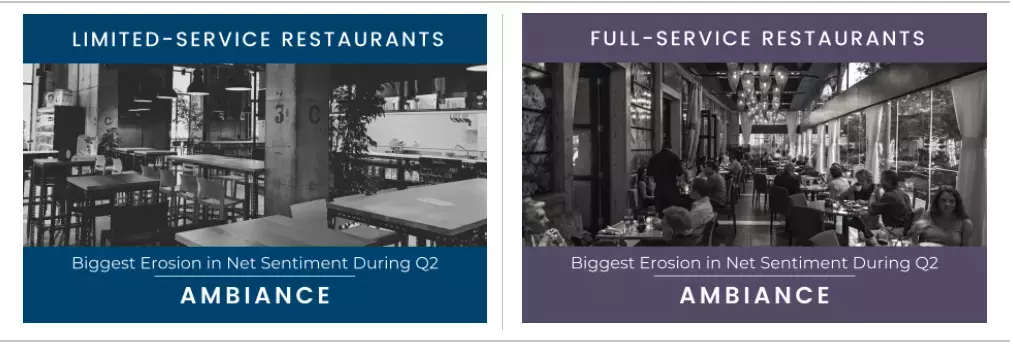
Sentiment based on restaurant “ambiance” dropped the most for both limited-service and full-service brands. Guests were aligned on what component of “ambiance” drove the decline as sentiment for “cleanliness” dropped significantly across the industry.
In the case of full-service restaurants, “cleanliness” net sentiment* dropped by 13 percentage points during the quarter. Some of the common themes mentioned regarding “cleanliness” focused on the tables and floor of the restaurant, high-touch items such as tableware and cutlery, or the state of the bathrooms. Many of the comments signaled a return to basics in terms of “cleanliness”, touching upon the kind of expectations that existed pre-pandemic and not necessarily tying them back to the safety and health concerns that drove the guest’s focus over the last year.
Similarly, “cleanliness” net sentiment for limited-service restaurants fell by 16 percentage points during the quarter. Although more than 70% of all limited-service sales continue to go through off-premise channels, there are challenges in keeping restaurants clean for guests who decide to come in. The cleanliness-related themes commonly covered in online reviews during Q2 included assessments of tables and floors, bathrooms, and mentions of trash found in various parts of the restaurant.
*Net sentiment is a value representing the percentage of positive mentions minus the percentage of negative mentions for a specific attribute of the restaurant experience.
Top DMAs
- Food- Orlando, FL
- Service- Tampa, FL
- Intent to Return- Houston, TX
- Beverage- Orlando, FL
- Ambiance- Orlando, FL
- Value- Indianapolis, IN
Bottom DMAs
- Food- San Francisco, CA
- Service- San Francisco, CA
- Intent to Return- Seattle, WA
- Beverage- St. Louis, MO
- Ambiance- Miami, FL
- Value- St. Louis, MO
The rapid rise in COVID cases in Florida has not yet affected most of its major markets. Orlando topped the list of metropolitan areas with the highest restaurant sentiment based on “food”, “beverage” and “ambiance”, while Tampa posted the most positive sentiment for restaurant “service”. Miami is the exception in Florida with the lowest net sentiment during July based on “ambiance”. This attribute of the restaurant experience has been key during the COVID era due to its close connection to cleanliness. Furthermore, last month Miami barely made the bottom 10 based on the lowest “ambiance” sentiment. During July, its net sentiment tumbled 4.4 points and put them at the bottom of the list.
Things are not looking bright for the San Francisco-Oakland-San Jose metropolitan area. This major market posted the worst restaurant same-store sales growth during July as well as the lowest net sentiment for restaurant “food” and “service”. It also had the second-lowest net sentiment based on guests’ stated “intent to return”.
Seattle, San Francisco, Miami, and Boston were on the list of markets with the lowest “intent to return” sentiment during July, as well as the worst same-store sales results during the month.