Restaurant Guest Satisfaction Snapshot™ – September, 2021
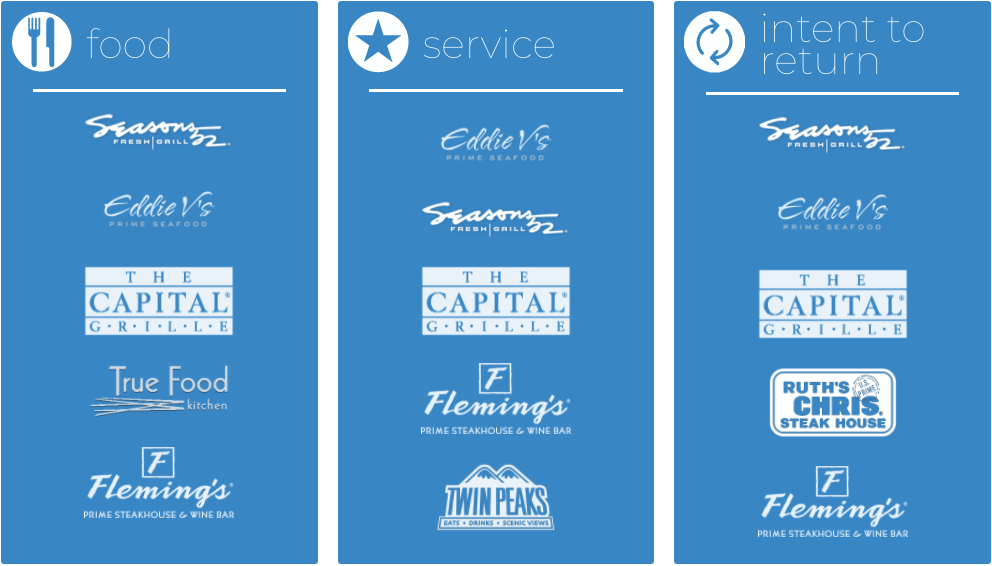
Top 5 Restaurant Brands
September brought mixed results for restaurants. On one hand, the 6.1% sales growth for the month was a 0.4% improvement from August. On the other hand, the industry was unable to return to the strong sales growth posted in June and July. Furthermore, there are still no signs of traffic recovering to pre-COVID levels. Traffic growth was -6.3% during September, the worst month since March.
In addition to soft sales and traffic, the industry continues to face widespread labor shortages, supply chain difficulties, and online guest complaints noting the deterioration in the restaurant experience.
During September, restaurant ‘food’ received 1.3% fewer positive mentions in online reviews compared to a year ago. Although the decline in sentiment has been gradual, September had the lowest percentage of positive reviews centered around restaurant ‘food’ since February. The story is similar for ‘service’ sentiment, which received 2.3% fewer positive mentions in September vs. a year ago. This was the lowest percentage of positive mentions based on restaurant ‘service’ since June.
Not surprisingly, guests are less positive about their intent to return to those restaurants they have reviewed or commented about online. The percentage of positive ‘intent on return’ mentions declined by almost 3% year over year.
Connecting the Dots on Performance
Setting the Standard: How Ambiance Elevates Top Restaurant Performers
Sales growth results for top performers* in limited-service restaurants were 9% higher than those in limited-service during Q3, while top performers in full-service had 13% more sales growth compared to the median growth in this sector of the industry.
But how did these top performers set themselves apart the most in the eyes of their guests? In which areas of the restaurant experience are they excelling at the most compared with their competitors?
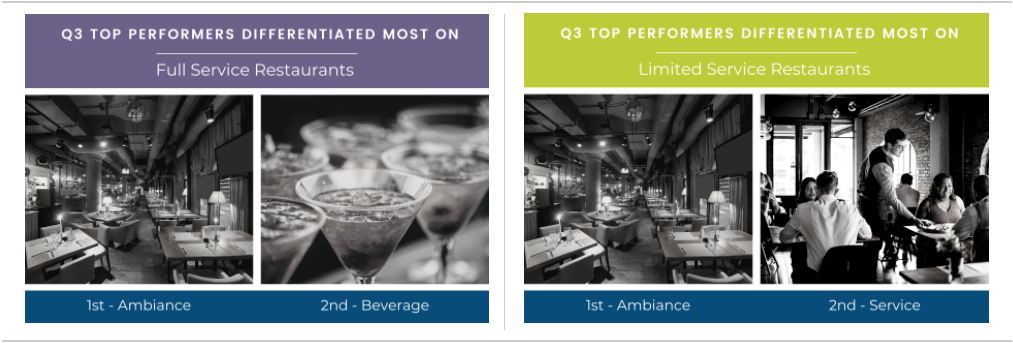
In limited-service restaurants, ‘ambiance’ was the restaurant experience attribute that had the biggest difference in net sentiment for top performers. Top-performing brands in limited service had an ‘ambiance’ net sentiment that was 11 points more positive than the rest. The second attribute through which top performers most differentiated themselves as ‘service’, with their net sentiment being 5 points more positive than the ‘service’ sentiment for limited service overall.
The importance of ‘ambiance’ is the one thing that top-performing full-service brands have in common with their limited-service counterparts. “Ambiance’ net sentiment for top performing brands was a remarkable 21 points more positive than for the rest of full-service. ‘Beverage’ was the second attribute that top performers excelled at the most. Guests rated beverages at top-performing full-service restaurants 17 points more positively than the rest of the competitors in this space.
Top DMAs
- Food- Orlando, FL
- Service- Orlando, FL
- Intent to Return- Orlando, FL
- Beverage- Orlando, FL
- Ambiance- Philadephia, PA
- Value- New York, NY
Bottom DMAs
- Food- San Francisco, CA
- Service- San Francisco, CA
- Intent to Return- Minneapolis, MN
- Beverage- Raleigh, NC
- Ambiance- New York, NY
- Value- Raleigh, NC
Among the top 25 largest markets in the country, Orlando led in positive net sentiment based on restaurant ‘food’, ‘beverage’, ‘service’, and ‘intent on return’. It was also a good month for Philadelphia, which topped the list for highest net sentiment based on ‘ambiance’, and was also among the top 3 markets based on ‘food’ and ‘service’.
New York offered some deep contrasts during the month. Although it was the major market with the most positive ‘value’ sentiment and ranked 3rd for ‘service’, it was also the DMA with the weakest ‘ambiance’ sentiment in September.
As seen in recent months, San Francisco continues to have challenges with its guest sentiment. It ranked at the bottom for ‘food’ and ‘service’ sentiment during September.
Looking Ahead
The big picture will remain the same for the restaurant industry through the rest of the year. Sales will remain better than they were back in 2019, but guest counts will still be down while guest checks continue growing at an unusually high pace.
Three hardening conditions for restaurants point towards more slowdown in sales and traffic in upcoming months.
- Prices for food at restaurants have increased at a much faster rate than prices for food prepared at home, suggesting restaurants are becoming less competitive versus grocery stores. Given that disparity, there is little room for traffic improvement.
- The expected slowdown in the overall economic growth and rising inflation will be a drag on future restaurant sales growth.
- Restaurant performance was stronger during the fourth quarter of 2019 than it was in previous quarters, which means tougher comparisons when analyzing sales and traffic growth in the upcoming quarter.
However, there is also reason for some optimism about what could be a good holiday season for restaurants. There is still pent-up demand and people are hungry to go out and celebrate again with friends and family, especially after having to skip much of that last year.