Restaurant Industry Snapshot™ – April 2021
April comp sales improved 4.6 percentage points from March, reaching 6.8% over 2019. But the latest traffic data indicates that the industry can’t quite call recovery complete. Nonetheless, sales are accelerating and the biggest driver is check growth. Year-over-year check growth in April grew by 5.2%.
All industry segments except for family dining were able to post positive 2-year sales growth. Quick service performed the best, followed by fast casual. Full-service restaurants were finally able to reach positive same-store sales for the first time since the beginning of the pandemic.
Regional & Market Performance
43 states posted positive same-store sales growth, and 8 more states from the previous month. This is more on par with 2019, with 40 states posting positive sales, on average, each month.
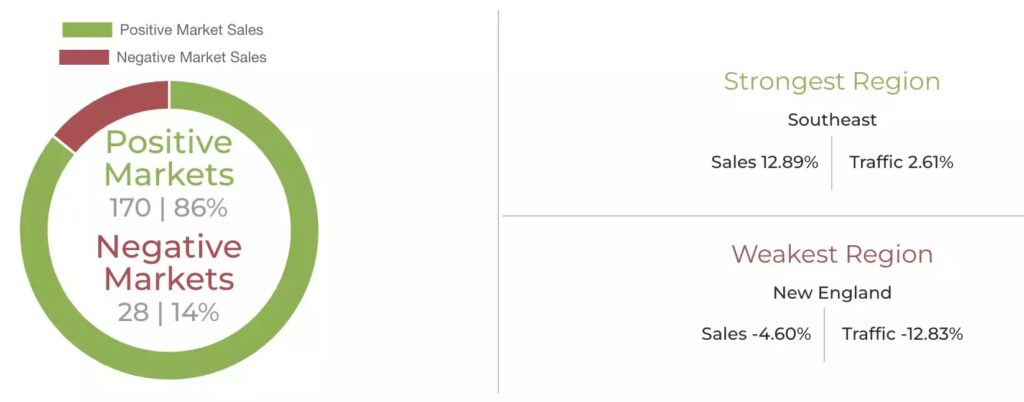
86% of markets posted positive sales in April, up from 72% in March. The Southeast had the strongest performance in April with New England faring the worst.
The Restaurant Workforce
Job Growth & Turnover
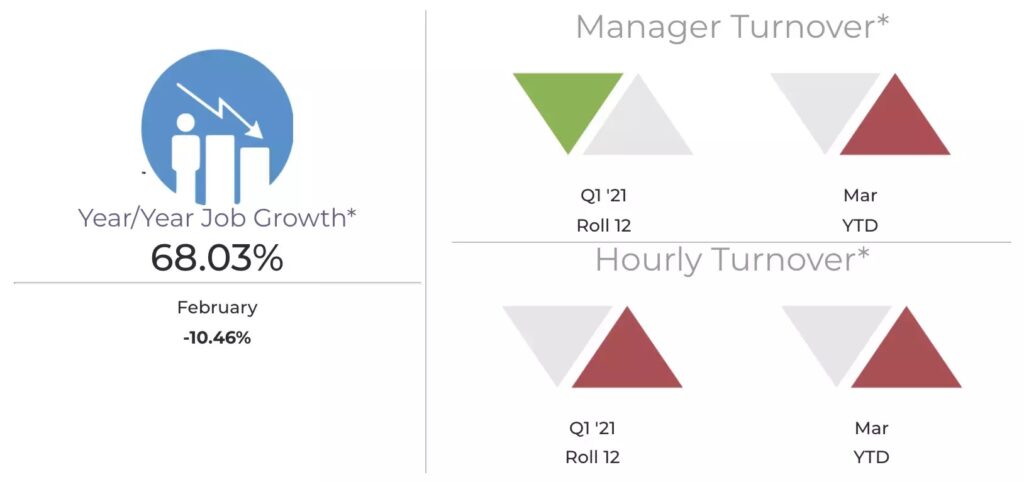
Accelerated sales exacerbate the staffing challenges as most restaurants are still operating with fewer employees than before the pandemic. High turnover does not help either, currently at 125% for hourly team members in limited-service brands and nearly 100% for full-service hourly employees between October 2020 and March 2021.
The industry has been aggressive this year and continues to add new jobs. Nonetheless, the consensus among restaurant operators is that there simply aren’t enough employees.
Restaurant Staffing & Growing Guest Counts Challenge Industry While Sales Accelerate in April
For the second consecutive month, 2-year same-store sales growth was positive. Restaurant sales are posting growth rates not seen in many years and are now consistently better than they were at the beginning of 2019 before COVID-19 wreaked havoc on the industry.
April same-store sales growth was 6.8% over 2019, a robust improvement of 4.6 percentage points from 2.3% growth in March. April’s growth is by far the strongest in the last three years. For comparison, these results are double the 3.3% 2-year same-store sales growth recorded for December of 2018, the highest it has been in three years.
Despite Improvement, Traffic Not Fully Recovered
The latest traffic data reveals that it is still too soon to call recovery complete. Although April traffic growth outperformed all other months of the pandemic era by a wide margin, it is far from the -0.5% 2-year traffic growth posted in January 2020 or -1.8% recorded for February. Restaurant 2-year same-store traffic growth improved to -4.2% during April, a 4.9 percentage point improvement from March’s 2-year growth.
Restaurants have dealt with an overly-built industry capacity, creating an obstacle to growing guest counts at existing restaurants. Thus, same-store traffic (both year over year and 2 years) has been negative for the last decade. With reduced restaurant capacity from the economic crisis caused by COVID, the theory is that traffic growth results may benefit in the near term. But we will have to wait until guest counts return at least to where they were 2 years ago.
No Signs of Check Growth Returning to Pre-COVID Level
Rapid acceleration in average checks* is the driving force behind the industry’s positive sales growth. The check average grew by 11.6% during April compared to April 2019. Despite the industry’s significant recovery more than a year into the pandemic, a rapid acceleration in check continues to persist. In April, checks grew by 5.2% year over year, a significant jump from the 3.2% growth recorded for all of 2019. Considering year-over-year check growth during the month was this high when lapping over 6.4% check growth a year ago, no signs indicate that industry check growth is returning to pre-COVID levels.
Segment data reveals different dynamics at play between limited-service** and full-service segments***. After many months of rapidly growing average checks, Quick Service’s check is now flat year over year. Average guest checks for fast casual dropped during April. Meanwhile, the opposite is true in full-service segments, which have seen a spike in their year-over-year spend per guest since March, as they lap over months of dine-in being closed and alcohol sales practically disappearing.
*average checks per guest/transaction
**Limited service: quick service and fast casual segments
***full service: family, casual, upscale casual and fine dining segments
Full-Service Achieves Positive Growth for First Time in Months
Except for family dining, all industry segments posted positive 2-year same-store sales growth in April. Quick service was the best-performing segment during April, followed by fast casual. Combined, limited-service segments posted 2-year same-store sales growth of 12.5% during the month.
April represented an important milestone for full-service restaurants. For the first time in the COVID era, their 2-year same-store sales reached positive territory. Full-service sales during April were 3.2% higher than they were during the same month back in 2019.
Off-Premise Sales Grew by 31.1%, Dine-In Down
Improvement in same-store sales growth for limited-service restaurants is primarily from an acceleration in the growth of strong off-premise sales. Drive-thru sales, delivery, and to-go grew by 31.1% over the last two years during April, up from the 23.5% growth recorded in March. Sales through these off-premise channels are well over 80% of all limited-service sales. Limited-service restaurants lost a considerable portion of their dine-in sales and were down by 51.5% in April. This is a marginal improvement from the 54.2% 2-year dine-in sales loss incurred back in March.
On the contrary, sales from dine-in guests in full-service restaurants improved to a 2-year growth rate of -16.1% in April, up from -20.1% reported in March. Off-premise sales growth lifted overall sales into positive territory for the first time in the last year. Off-premise sales improved by 134.4% in April over 2 years. Although an outstanding pace of growth, it is lower than the 140.3% 2-year growth reported for March.
Late-Night Daypart Still Struggles, Alcohol Sales Recovering Slowly
The late-night daypart had a 2-year same-store sales growth of -4.9% and is the only daypart that didn’t post better comp sales compared to two years ago. Although far from full recovery, late-night sales have improved significantly from being down by more than 25% on a 2-year basis from November through February.
Mid-afternoon was the best-performing daypart in April, with 2-year sales growth of 17.9%, followed by dinner with 9.7%. Lunch was up 3.6% compared to April of 2019, the first time this daypart was able to post 2-year positive sales growth since the beginning of the pandemic. Breakfast sales growth slipped to 1.2%, down from a 2-year growth of 3.7% in March.
Alcoholic beverage sales in full-service restaurants have seen a significant recovery in the last two months but still lag food sales by a wide margin. Alcohol sales were down by 14.4% during April based on 2-year growth and represented 11% of all full-service restaurant sales in April, up from 10% in March. Before March of last year, the typical results were alcohol sales hovering around 14% of full-service sales.
Sales Recovery Widespread Throughout the Country
43 states saw positive 2-year same-store sales growth in April. With 8 more states posting positive results over March, this is the best result since January of 2020. 40 states posted 2-year same-store sales growth each month in 2019, on average. Massachusetts, Vermont, Connecticut, New Jersey, New York, Rhode Island, and Illinois did not see positive 2-year sales growth in April. The District of Columbia was the worst performer in April.
The Southeast, Southwest, and Western regions (excluding California) were the best-performing regions of the country based on sales growth during April. All posting 2-year same-store sales growth better than 11%.
Restaurants Remain Understaffed, High Turnover an Obstacle
As the economy strengthened, a tightening of the labor market and an acceleration of restaurant sales increased the staffing pressures for the industry. According to the Bureau of Labor Statistics, 187,000 new jobs were added by restaurants during April. The industry has been hiring aggressively in 2021. Since January, restaurants have added close to 650,000 new jobs in total. Even if those topline numbers suggest rapid employment growth, the prevailing narrative coming from restaurant operators is that this growth spurt has not been enough.
Restaurants are running at lower staffing levels than in 2019. While most cuts in 2020 were unavoidable due to COVID, there has been little movement in recent months suggesting that is extremely hard to find restaurant employees. The median limited-service restaurant chain ran with one less hourly team member per location in March of 2021 vs. 2019. The median full-service chain ran with almost 11 fewer front-of-house and 3 fewer back-of-house hourly employees during March vs. 2019.
Staffing challenges don’t come as a surprise for an industry that has traditionally suffered from high turnover. Annualized turnover from October 2020 – to March 2021 is currently 125% for hourly team members in limited-service brands and close to 100% for full-service hourly employees.
Macroeconomic Conditions Support Sustained Restaurant Demand Through Rest of Year
Recovery is still on track, despite a disappointing employment report in April. “Making judgments based on a single month’s number can often lead to misleading conclusions,” advised Joel Naroff, president of Naroff Economic Advisors. “The reality is that most states have either reopened or set a timetable for when they will fully reopen. By the end of June, there should be few restrictions left and that will generate even more demand for workers.
“More importantly, with the government distributing enhanced unemployment and stimulus checks, personal income is soaring. At the same time, confidence is rising. Together, they point to continued robust consumer spending. Since households are also saving a significant portion of the stimulus funds, there should be sufficient income to support solid spending even after the checks stop coming in September. Look for sustained restaurant demand through the rest of 2021.”
Looking Ahead
As the economy continues growing, all indicators point to restaurants continuing to outperform in 2019. The only caveat is those states that are considering stopping the expanded federal unemployment benefits as soon as June.
The biggest challenge for the industry is growing guest counts. Declining same-store traffic has been the norm for over a decade. The closure of many restaurants offered an opportunity for correction in an overly saturated industry. But even with pent-up demand, fewer restaurants available and consumer spending boosts from stimulus checks, 2-year same-store traffic growth in April was still negative and worse than the traffic growth recorded for 2019.
As year-over-year check growth starts tapering and restaurants lap over the skyrocketing check growth of the COVID era, restaurants will have to rely on improving traffic if they are to keep up the robust sales growth experienced in recent months.
To support sales growth and improve guest counts, restaurants will need to be staffed. The workforce model for the restaurant industry needed repair before the current crisis exacerbated the problem. Brands must realize that pay is a central decision point when competing for talent. Simultaneously, it is crucial to strike the right balance between development, flexibility, and a strong company culture.