Restaurant Guest Satisfaction Snapshot™ – April 2022 Top 5 Restaurant Brands
Financial metrics are “same-store” metrics & reported on a 1-year comparison unless otherwise noted
The good news for the restaurant industry is that sales growth continues to be positive. The industry. experienced a 15-month streak of improving sales year over year. The last time industry sales growth was negative was in February of 2021 when restaurants were coming off a new high in the number of Covid cases at the end of 2020. But the unwelcome news is the rate of growth has been slowing down considerably, with April’s +5.3% sales growth the weakest during that same period. Further weakening is expected in the months ahead, as the industry continues lapping over increasingly harder sales hurdles.
Furthermore, the more concerning news for the industry comes in the form of the persistently eroding guest counts experienced in recent months. Traffic growth was -2.7% in April, which represented a softening of 1.0 percentage points compared with March’s growth rate and was the second consecutive month in which traffic growth has been negative year over year.
In April, restaurants were able to provide a strong service experience to their guests. Service net sentiment* improved by a healthy 7 percentage points year over year during the month. This month sported the highest service net sentiment since the beginning of 2021. This is welcome news for an industry that has been heavily challenged by staffing difficulties, which have hindered execution since last Spring.
Food net sentiment dipped slightly year over year (falling by 0.7 percentage points), but this was mostly due to a tough comparison from a year ago. April of 2022 had the second highest guest sentiment for restaurant food since the beginning of 2021; the only month with higher sentiment was April of last year. However, food net sentiment did become 1.2 percentage points more positive during April 2022 relative to the previous month.
Connecting the Dots on Performance
It is no secret that prices in the overall economy are growing at an exorbitant rate and are erasing the gains made by consumers through rapid wage increases. Restaurants have been no exception, and the biggest concern is that the extraordinary rises in menu prices are far from over. According to a recent poll conducted by Black Box Intelligence™, 45% of restaurant operators estimated that their menu prices would be at least 7% higher by the end of 2022 compared to where they were on average at the end of 2021. An additional 27% of companies are expecting their menu prices to go up between 5% and 7% by the end of the year.
With prices increasing at such an accelerated rate, consumers are undoubtedly feeling the pressure and beginning to make purchasing decisions based on the associated impact on their budgets. Throughout the pandemic, value sentiment reduced in its relative importance, as guests focused on other areas of the restaurant experience as key drivers behind their dining preferences. But that is soon likely to change.
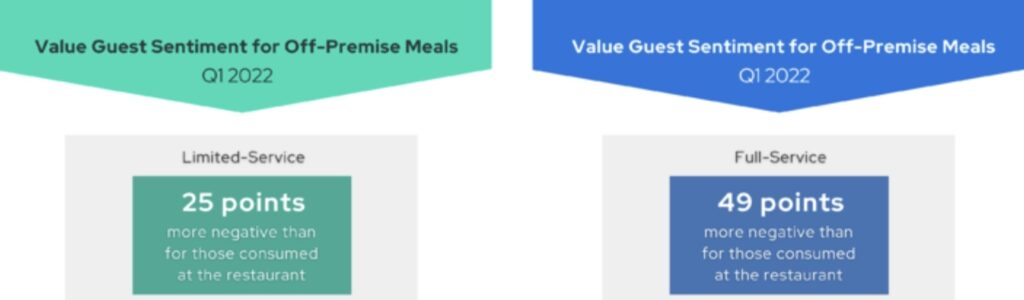
One of the interesting new dynamics around value guest sentiment is happening around off-premise, which has increased its relative importance for most restaurants as its share of total restaurant sales has maintained at higher levels than they had pre-Covid. Value net sentiment is much lower for off-premise offerings than for dine-in, which means overall value net sentiment scores are being brought down by the larger off-premise activity.
In the case of full-service restaurants, the value net sentiment is 12% for dine-in meals. For those purchased for off-premise consumption, value net sentiment drops to -37%, a dramatic drop of almost 50 percentage points. For limited-service brands, value sentiment was negative even for dine-in as of Q1 2022 at -7%, but guests were a lot more negative when rating value they obtained through the off-premise channels. Off-premise value net sentiment was -32%, a significant decline of 25 percentage points compared to dine-in.
What are some of the factors behind the extremely negative value sentiment assigned to off-premise restaurant meals? In the case of delivery, the presence of delivery fees may be a driver of some of this value sentiment erosion. Those meals would become more expensive once delivered than the equivalent of being picked up from or consumed at the restaurant. But more than anything, it is the fact that food sentiment is also much lower for off-premise offerings that are driving down the value scores. Guests frequently complain about cold food, incorrect orders, and long wait times when ordering threw off-premise channels. They are aware that they are paying much more for those meals than they did a few months ago and are quick to point out when the meals they are receiving do not satisfy their expectations. With higher price tags, expectations also tend to rise. Value is much more than just price; it is relative to what you get for the money you are paying. In the case of off-premise, what you get may not be as good as what you get by dining in from a food and service experience, and the expectations may simply be higher given the money being spent across all channels.
Top DMAs
- Food- Orlando, FL
- Service- Raleigh, NC
- Intent to Return- Raleigh, NC
- Beverage- Houston, TX
- Ambiance- Orlando, FL
- Value- Orlando, FL
Bottom DMAs
- Food- San Francisco, CA
- Service- San Francisco, CA
- Intent to Return- San Francisco, CA
- Beverage- Seattle, WA
- Ambiance- Sacramento, CA
- Value- Atlanta, GA
Guests in Orlando exhibited the most positive sentiment for chain restaurants across several key attributes. During April, this metropolitan area topped the list based on the most positive food, ambiance, and value sentiment. Raleigh was the most positive market for service and intent to return, while Houston was the DMA with the strongest beverage sentiment.
Beyond Orlando, the major markets that had the highest net sentiment for restaurant food during the month were Raleigh, Tampa, Indianapolis, and Houston. The markets that were at the top of the list for the most positive service sentiment behind Raleigh were Orlando, Tampa, Houston, and Charlotte.
On the other hand, major markets on the West Coast posted the lowest sentiment scores across most of the attributes of the restaurant experience. San Francisco had the lowest net sentiment for food, service, and intent to return, while Sacramento was at the bottom of the list for ambiance. Seattle was the DMA with the lowest beverage sentiment.
California, especially, has exhibited lower net sentiment scores than other areas of the country. All three major DMAs with the lowest restaurant food net sentiment are in San Francisco, Sacramento, and Los Angeles.