
March Restaurant Overview
Decelerating Sales Growth, Traffic Trends, and the Power of Guest Sentiment
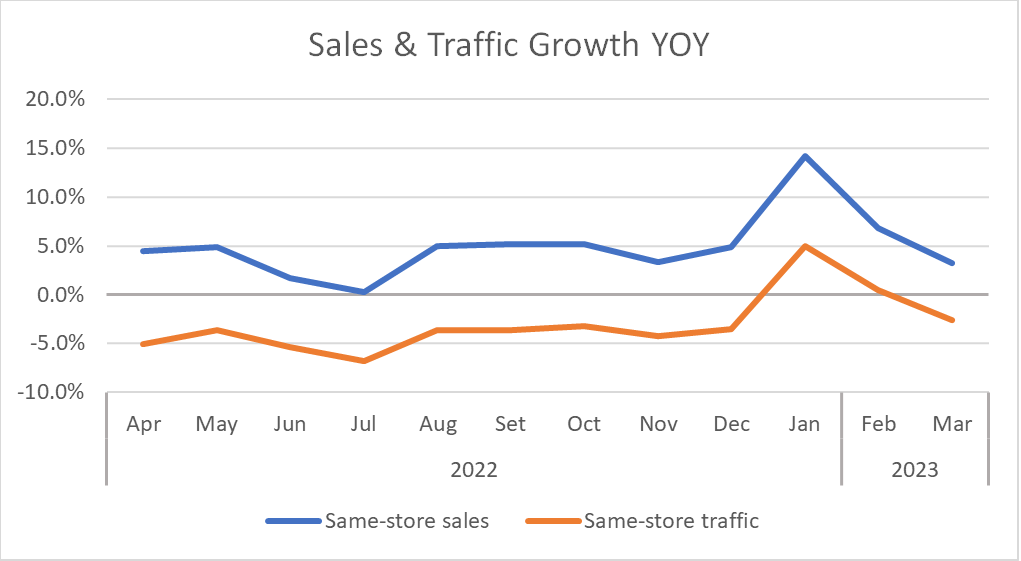
As soon as the positive lift from the Omicron impact faded, which had produced some very easy comparisons when calculating year-over-year growth during the first two months of the year, the industry’s sales-growth performance dropped rapidly, falling to its lowest level since July. Restaurant same-store sales growth was 3.2% during March, a drop of 3.7 percentage points in year-over-year growth compared to February. March’s performance represented a softening in sales growth compared to November and December, the last months before the easy Omicron laps disrupted the numbers.
But not everything was bad news for traffic, which offered mixed results during the month. On one hand, same-store traffic growth was -2.6% for March, which represented a 3.1 percentage-point drop compared to February. Excluding the months positively impacted by the Omicron lap (January and February), traffic growth has now been negative since March of last year. On the other hand, traffic growth held up better than sales during the latest month. March’s same-store traffic growth was the strongest posted by the industry since February 2022 (excluding the months that were artificially strong due to the Omicron lap).
All segments experienced negative same-store traffic growth during March. But the segments with the best traffic results were those in limited service: fast casual and quick service. The data continues to support the idea of consumers trading down to these segments with lower average guest checks (and low or no tips) in response to the highly inflationary environment they have been battling over the last two years. The expectation continues to be for these segments to be better positioned in the marketplace during the year.
The deceleration in average guest check growth is likely helping slow the erosion of restaurant guest counts. As cost pressures from rapidly rising wages and commodity prices have moderated in recent months for restaurants, menu price increases and their effect on average guest checks have also slowed down. Average guest checks for all restaurants increased by 6.2% year over year in March, a deceleration of 0.3 percentage points compared to February and the lowest growth rate recorded for the industry in over two years.
Dissecting Restaurant Reviews
Readers of the blog know that GuestXM has long been advocating the power of guest sentiment for restaurants. As mentioned in our February restaurant sales and traffic trends report, restaurants that improved their average star rating saw their traffic increase by 3% over three years, while those with a negative change had a 1-point decrease in traffic.
Online review sites have an unmistakable impact on sales and traffic, which is why it is worth diving into the kind of feedback that is the most impactful.
Black Box Intelligence’s Natural Language Processor splits reviews into six main categories (Food, Beverage, Service, Ambiance, Value, and Intent to Return) and hundreds of sub-categories. Each category’s Net Sentiment (NS) score is simply the percentage of positive reviews minus the percentage of negative reviews. From there, we can see which categories have the best correlation with sales and traffic growth.
Food and Service Are Strong Indicators
For the restaurant industry, ratings related to food are currently the most consistently correlated with sales and traffic. The “best” (those in the top quartile) brands based on Food NS in Q1 2023 show positive traffic year over year, while the “rest” average negative traffic. However, due to Omicron affecting Q1 of 2022, year-over-year growth is not the best measurement.
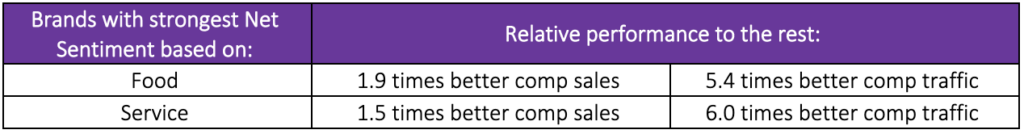
The contrast is even starker when we look at growth since 2019. The brands with the best Food NS in Q1 2023 have 1.9 times better four-year comp sales and 5.4 times better four-year traffic growth than brands in the bottom three quartiles. Reviews related to service also reveal a strong relationship. Brands in the top quartile for Service NS have outperformed the other quartiles 1.5 times in comp sales and a massive 6 times in traffic.
Value is Deceptively Important
Surprisingly, Value did not show a strong relationship. Brands in the top Value NS quartile in Q1 2023 recorded slightly worse four-year sales (although their traffic was 1.2 times better) than brands with lower-Value NS scores.
However, this is likely not an accurate reflection of the importance of Value sentiment. Price has been the most volatile factor in the past several years. Since 2019, inflation is up 18%, and consumers are much more cognizant of price and portion and have heightened expectations in terms of the overall experience they now want for their money. Therefore, it doesn’t make sense to look at a static NS score when determining Value’s impact on financial performance.
Instead, if we look at the change in NS over four years, we find Value is the most significant category. The brands that saw the most improvement in their Value NS scores over the past four years saw 1.5 times better sales growth and an enormous 8 times better traffic.
Tracking Reviews Is More Important Than Ever but No Longer Sufficient
While essential, the ability to track online review ratings and counts is no longer enough. As technology becomes more sophisticated, analyzing reviews beyond the basic five stars is necessary to stay ahead of the pack. Dissecting reviews into their parts, understanding what types lead to better sales and traffic, and being able to track and react to them is the optimal way to improve ratings consistently over long periods, and that in turn will lead to better financial results.